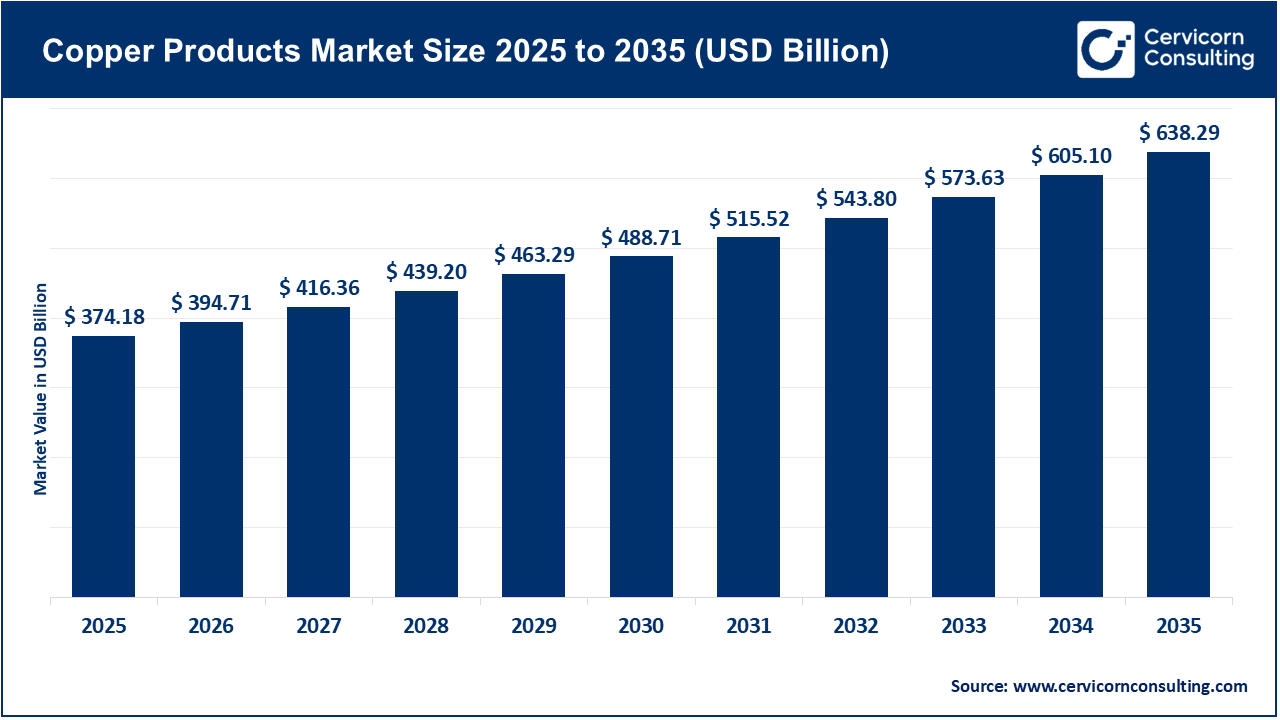
The global copper products market size was valued at USD 374.18 billion in 2025 and is expected to be worth around USD 638.29 billion by 2035, exhibiting at a compound annual growth rate (CAGR) of 5.5% over the forecast period 2026 to 2035. The copper products market is driven by several factors, including electrifying infrastructure and growth in renewable energy and sustainability. In fact, the unique electrical and thermal conductivity properties of copper allow it to be a valuable component in wires, rods, tubes, and foils used in construction and grid-upgrades, electric vehicles (EVs), and data centres. Urbanization and industrialization in emerging economies (especially in Asia-Pacific) are also amplifying demand for copper products in building construction, HVAC systems, and electronics manufacturing.

On the trade side, the copper products market is affected by global import - export flows and changing policy environments. For example, semi-finished copper exports from India were roughly USD 1 billion for FY2025 with about 17% of that being exported to the U.S. Globally, “copper wire” (HS 7408) had a trade value of around USD 26.3 billion in 2023. Also, global copper ore export flows show that in 2023, some of the largest flow came from countries like Chile (USD 24 billion) and Peru (USD 19.9 billion). These export flows show how availability of the raw material, processing capacity and trade policies all affect market dynamics for finished copper products.
What are copper products?
Copper products comprise materials and components made from copper or copper alloys. These products are used in electrical, construction, transportation, and industrial applications due to copper's unique properties such as electrical and thermal conductivity, corrosion resistance, and malleability. These products can be made from the following processes: casting, extrusion, rolling, or drawing, and they can be classified as intermediate products whether they are used in wiring, piping, electronics, power generation, and heat exchangers.
Recent tariff impacts on the copper products market and companies in 2025:
The global shift to renewable energy and energy storage systems is driving up demand for copper products. Copper's electrical and thermal conductivity will make it an essential component of solar, wind, energy storage, and electric vehicle infrastructure. For example, wind farms utilize tons of copper wire per kilowatt for cabling and generators. Investment in electrical networks, battery energy storage technologies, renewable energy decarbonization, and electrification is also increasing. Copper will be a critical enabler of the green energy transition as governments spend more in decarbonisation and electrification. Copper products and their value will remain a constant and efficient answer for everyday demands as they move through the supply chain.

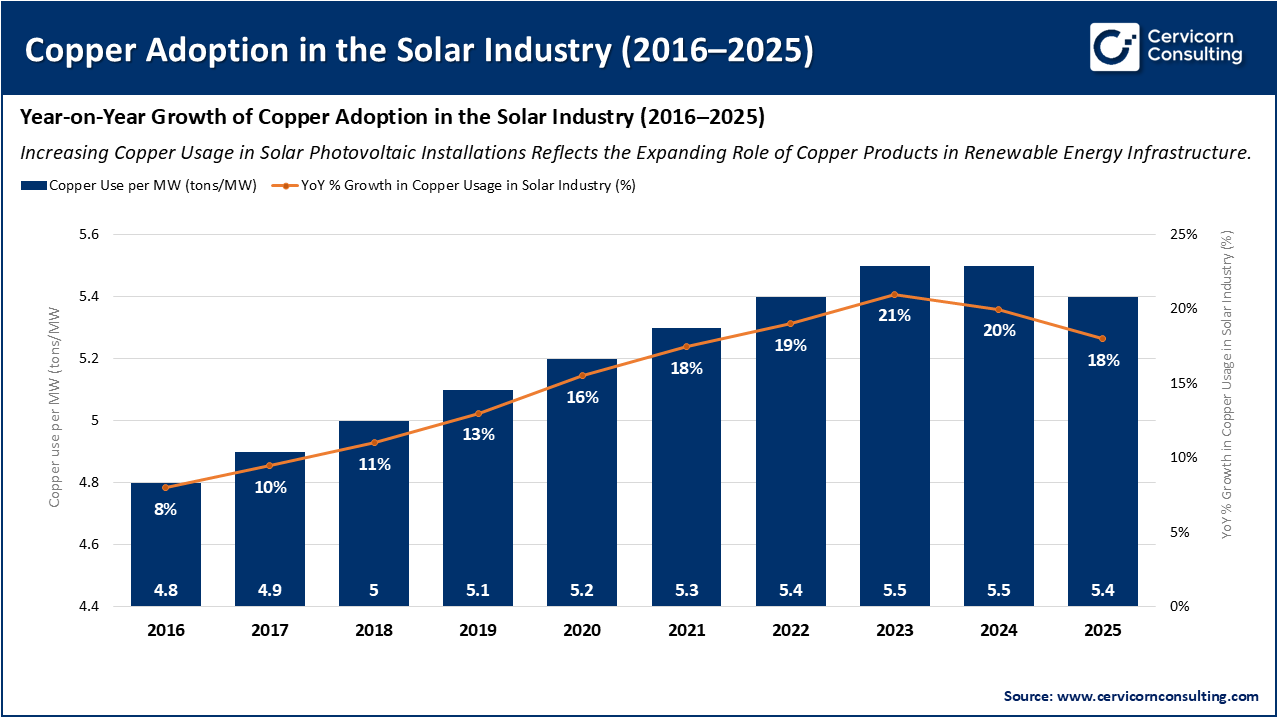
The graph shows that the growth of copper use for solar installations has driven year-over-year growth in the copper products market. Increased solar capacity increases the demand for copper wire, cable, and connectors. This promotes growth in the market and warrants copper as a primary material in the global transition to renewable energy.
Adoption and Usage of Copper Across Renewable Energy Technologies
| Renewable Energy Technology | Adoption of Copper | Key Usage Areas |
| Solar Energy (Photovoltaic Systems) | High | Used in PV cell connectors, inverters, transformers, and cabling for transmitting currents. |
| Wind Energy (Turbines & Farms) | Very High | Copper used in turbine generators, grounding systems, and transmission power cables. |
| Hydropower Plants | Moderate to High | Used in generators, transformers, and under water cable transmission. |
| Energy Storage Systems (Batteries & Grid Storage) | High | Copper used in battery terminals, conductors, and thermal management systems. |
| Electric Vehicles (EVs) & Charging Infrastructure | Very High | Used in EV motors, wiring harnesses, and high power charging stations. |
| Smart Grids & Transmission Networks | High | Used in transformers, sub stations, and smart metering infrastructure. |
| Geothermal Energy Systems | Moderate | Copper used in heat exchangers, pumps, and control wiring systems. |
Electrification and Renewable Energy Expansion
Infrastructure Modernization and Urbanization
Volatile Copper Prices
Environmental and Regulatory Constraints
Growth of Recycling and Secondary Copper Production
Technological Innovations and Alloy Development
Supply Chain Instability and Resource Concentration
Substitution Threat from Alternative Materials
The copper products market is segmented into various regions, including North America, Europe, Asia-Pacific, and LAMEA. Here is a brief overview of each region:

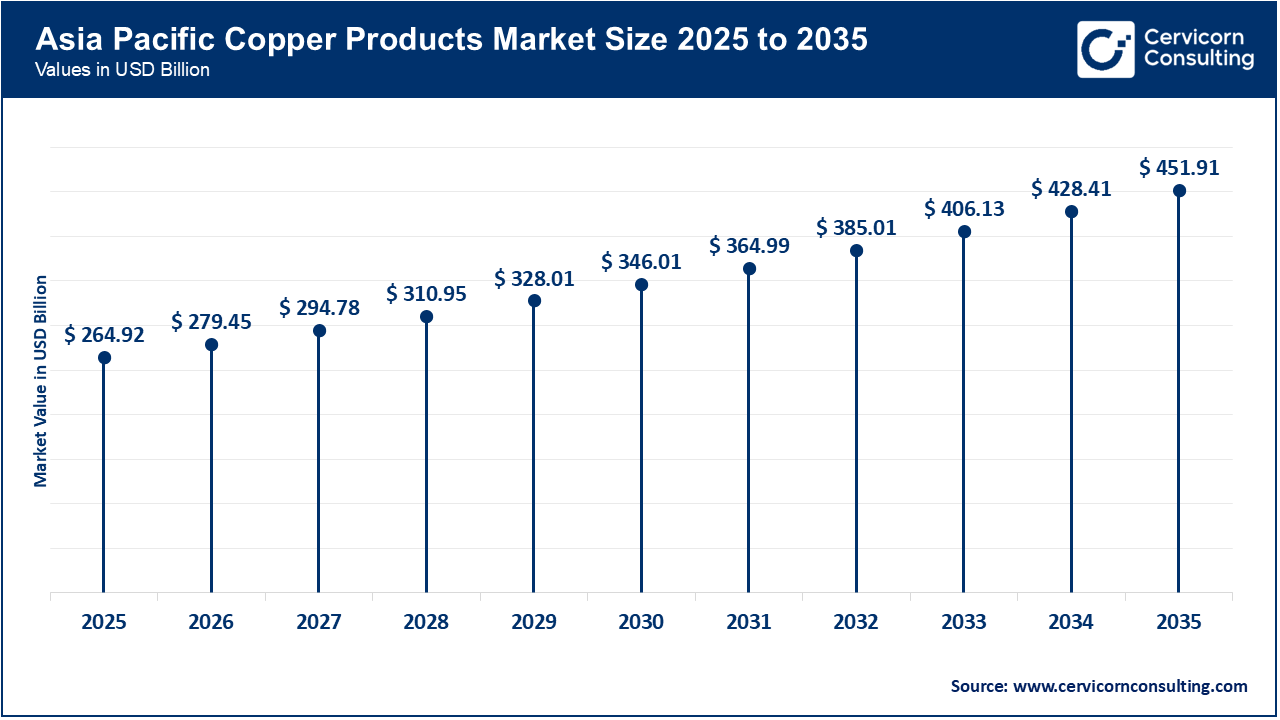
Asia-Pacific is most significant region in the copper products market, is expanding rapidly because of its high urbanisation, large scale infrastructure and industrial growth, and increasing use of electrification and renewable energy. With key countries like China and India ramping up construction, manufacturing, and EV production—all heavy users of copper products—Asia-Pacific is increasingly solidifying its competitive position. The region is also advantaged by being close to primary copper supply chains and processing capacity. The growth of Asia-Pacific tends to be faster than more developed markets, making it the fastest-growing region in many forecasts.
Recent Developments:
The North America is underpinned by several strong drivers including infrastructure improvements, the implementation of renewable energy, and improved manufacturing practices. The U.S. and Canada are investing substantial resources towards upgrades in grid improvements, electric vehicle (EV) charging stations and building upgrades, which are all positive impulses for increased copper consumption in the production of electrical wiring, busbars, cables and other products. Furthermore, the countries' leadership in technology coupled with a regulatory push towards decarbonisation continues to support high demand for copper products for high-performing applications. Conversely, while not growing as fast as some developing markets, there is effort taking place towards improved value copper products and recycling efforts are facilitating that transition.
Recent Developments:
The Europe is being influenced by the region's bold approach to renewable energy, electrification of transport and sustainable fabrication. Considerable investment has been committed to wind, solar PV, EV manufacture and upgrading the grid in Germany and France, which reinforces copper’s conventional position in both conductive and structural functions. In addition, the focus on the circular economy and stringent material specifications are prompting Europe to stress advanced copper alloy products, recyclability and grades of copper able to perform at a higher standard than traditional supply. However, growth rates are decreasing as the market continues to mature alongside supply chain challenges.
Recent Developments:
Copper Products Market Share, By Region, 2025 (%)
| Region | Revenue Share, 2025 (%) |
| Asia-Pacific | 70.8% |
| North America | 14.6% |
| Europe | 9.7% |
| LAMEA | 4.9% |
The LAMEA region offers significant opportunities. Latin America includes important copper producers such as Chile, Peru, etc., which will support upstream supply, while Middle East & Africa are ramping up infrastructure and renewable energy projects which need copper-intensive products. For example, the Middle East copper market is forecasted to grow at 4.9% CAGR between 2026-35, driven by solar, wind, and building wiring projects. The emerging nature of the region introduces high-potential growth, but includes risks of varying magnitude in terms of regulations, logistics, or economic conditions.
Recent Developments:
The copper products market is segmented into product, application, end-use industry, and region.
Copper wires are the largest product segment because they are the most widely used for electrical transmission, power distribution and communication systems. Copper has the best electrical conductivity, ductility and corrosion resistance of common wiring materials, making it the material of choice for electrical cables, winding wires and communication conductors. The continuous expansion of smart grids, data centers, and renewable energy systems has led to increased consumption of copper wiring. Moreover, higher levels of electric vehicle (EV) adoption (of which copper wires are used for battery wiring, charging stations and motor winding) have continued to lead the global markets for copper wiring.
Copper Products Market Share, By Product, 2025 (%)
| Product | Revenue Share, 2025 (%) |
| Wires | 34.7% |
| Tubes & Pipes | 18.2% |
| Bars | 10.6% |
| Rods | 9.4% |
| Strips | 7.8% |
| Foils | 6.2% |
| Alloy Products | 5.5% |
| Tapes | 4.1% |
| Others | 3.5% |
The tubes and pipes are the most rapidly growing segment, as demand from HVAC, plumbing and refrigeration is increasing. Copper tubes are becoming increasingly popular due to their conductivity, corrosion resistance and durability. Copper tubes are also fundamental in heat exchangers and air conditioning systems. The development towards sustainable refrigerants and energy-efficient cooling systems have also acted as a driver for the growth of copper tubes. In addition, increased use of copper pipes in residential and commercial building construction in Asia-Pacific areas (India and China) will guarantee sustained growth for this segment in the new decade.
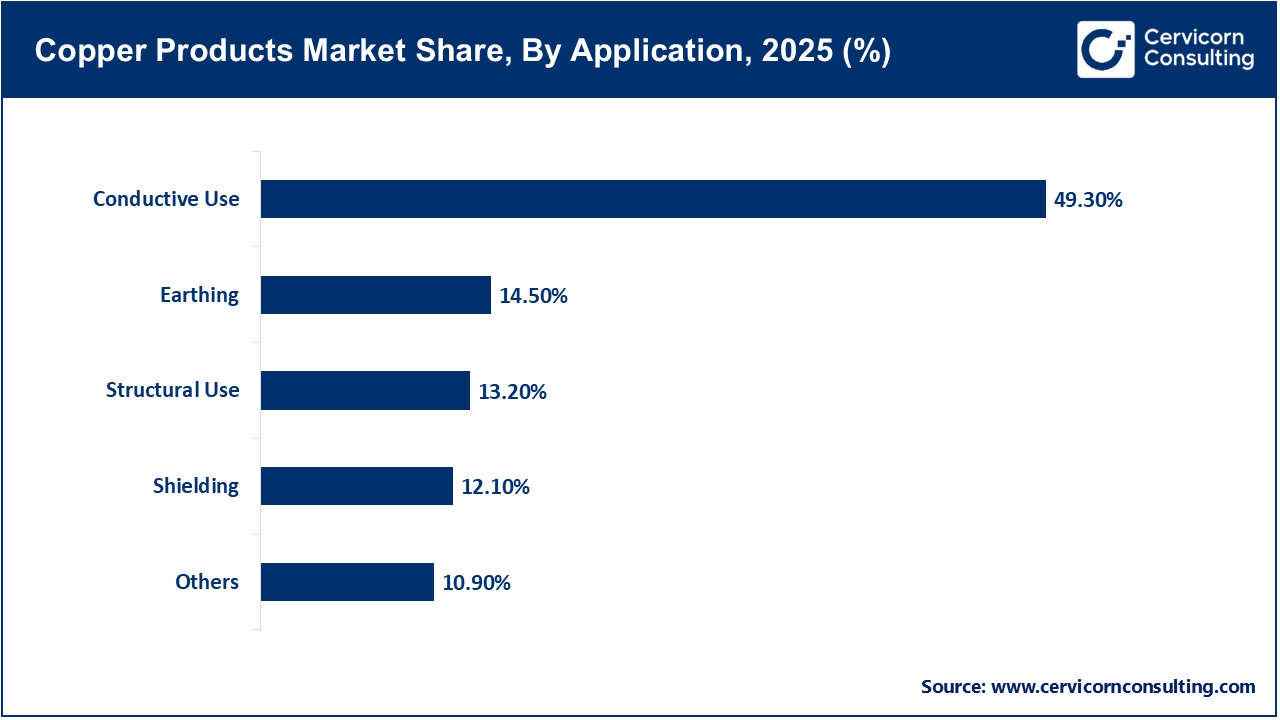
The conductive use segment continues to be the largest segment due to copper's superior conductivity in electricity and thermal applications. This segment includes things like power cables, wiring, motors, transformers, and busbars, which continue to be essential elements in electricity and energy systems today. Growing worldwide trends around electrification, renewable energy sources, digital infrastructure, and modernization of energy grids can support the growth of copper products in the conductive use segment. Moreover, global demand for electric charging stations—along with government pursuits of an upgraded grid and charging stations for electric vehicles—will also encourage this segment as copper, when applied within conductors, provides the greatest current flow with minimum energy loss.

The shielding segment is expanding at a rapid pace, driven by an increasing number of applications in the electronics, telecommunications and automotive industries. Copper's superior electromagnetic interference (EMI) and radio-frequency interference (RFI) shielding properties are excellent for protecting delicate circuits within modern devices. As 5G networks, smart devices, and electric vehicles ring out, the demand for copper foils and tapes for use in shielding applications has grown rapidly. Copper's antibacterial properties continue to drive its use in medical devices, and in aerospace shielding systems, which will allow this market to grow rapidly.
The electronics industry is the leading end-use sector in the copper products market, which was driven by the rapid increase in consumer electronics, semiconductors, and digital devices. Due to its good conductivity and reliability, copper is a primary element found in printed circuit boards (PCBs), connectors, integrated circuits, and microprocessors. The Internet of Things (IoT) is also boosting demand for copper in the electronics market, as continual advances in miniaturization of electronic devices are growing at rapid pace. Furthermore, the growing data center and semiconductor sector in developing countries, including China and South Korea, and developed nations like the United States, continues to firmly establish the electronics market as the largest end-use market for copper products.
Copper Products Market Share, By End-Use Industry, 2025 (%)
| End-Use Industry | Revenue Share, 2025 (%) |
| Electronics | 28.4% |
| Electrical & Power Transmission | 22.7% |
| Building & Construction | 15.3% |
| Industrial Equipment & Machinery | 10.6% |
| Transportation | 8.9% |
| Power Generation | 6.5% |
| Plumbing | 4.2% |
| Metallurgy & Foundry | 2.3% |
| Others | 1.1% |
The electrical and power transmission is the fastest-growing end-user segment due to worldwide investment in renewable energy grids, electrification, and preparing smart infrastructure. Copper is necessary for efficient and reliable electrical transmission & distribution systems, transformers, and substations. The transition to low-carbon energy systems and the upgrade of aging electrical infrastructure in developed countries will substantially drive copper demand in the electrical and power transmission segment. At the same time, developing countries are rapidly expanding electrical power distribution networks, creating many opportunities in copper rods, bars, and cables for high-voltage and lower-loss electrical systems.
Market Segmentation
By Product
By Application
By End-Use Industry
By Region
Chapter 1. Market Introduction and Overview
1.1 Market Definition and Scope
1.1.1 Overview of Copper Products
1.1.2 Scope of the Study
1.1.3 Research Timeframe
1.2 Research Methodology and Approach
1.2.1 Methodology Overview
1.2.2 Data Sources and Validation
1.2.3 Key Assumptions and Limitations
Chapter 2. Executive Summary
2.1 Market Highlights and Snapshot
2.2 Key Insights by Segments
2.2.1 By Product Overview
2.2.2 By Application Overview
2.2.3 By End-Use Industry Overview
2.3 Competitive Overview
Chapter 3. Global Impact Analysis
3.1 Russia-Ukraine Conflict: Global Market Implications
3.2 Regulatory and Policy Changes Impacting Global Markets
Chapter 4. Market Dynamics and Trends
4.1 Market Dynamics
4.1.1 Market Drivers
4.1.1.1 Electrification and Renewable Energy Expansion
4.1.1.2 Infrastructure Modernization and Urbanization
4.1.2 Market Restraints
4.1.2.1 Volatile Copper Prices
4.1.2.2 Environmental and Regulatory Constraints
4.1.3 Market Challenges
4.1.3.1 Supply Chain Instability and Resource Concentration
4.1.3.2 Substitution Threat from Alternative Materials
4.1.4 Market Opportunities
4.1.4.1 Growth of Recycling and Secondary Copper Production
4.1.4.2 Technological Innovations and Alloy Development
4.2 Market Trends
Chapter 5. Premium Insights and Analysis
5.1 Global Copper Products Market Dynamics, Impact Analysis
5.2 Porter’s Five Forces Analysis
5.2.1 Bargaining Power of Suppliers
5.2.2 Bargaining Power of Buyers
5.2.3 Threat of Substitute Products
5.2.4 Rivalry among Existing Firms
5.2.5 Threat of New Entrants
5.3 PESTEL Analysis
5.4 Value Chain Analysis
5.5 Product Pricing Analysis
5.6 Vendor Landscape
5.6.1 List of Buyers
5.6.2 List of Suppliers
Chapter 6. Copper Products Market, By Product
6.1 Global Copper Products Market Snapshot, By Product
6.1.1 Market Revenue (($Billion) and Growth Rate (%), 2022-2034
6.1.1.1 Bars
6.1.1.2 Rods
6.1.1.3 Wires
6.1.1.4 Strips
6.1.1.5 Tubes & pipes
6.1.1.6 Foils
6.1.1.7 Tapes
6.1.1.8 Alloy products
6.1.1.9 Others
Chapter 7. Copper Products Market, By Application
7.1 Global Copper Products Market Snapshot, By Application
7.1.1 Market Revenue (($Billion) and Growth Rate (%), 2022-2034
7.1.1.1 Conductive use
7.1.1.2 Earthing
7.1.1.3 Structural use
7.1.1.4 Shielding
7.1.1.5 Others
Chapter 8. Copper Products Market, By End-Use Industry
8.1 Global Copper Products Market Snapshot, By End-Use Industry
8.1.1 Market Revenue (($Billion) and Growth Rate (%), 2022-2034
8.1.1.1 Electrical & power transmission
8.1.1.2 Metallurgy & foundry
8.1.1.3 Industrial equipment & machinery
8.1.1.4 Electronics
8.1.1.5 Transportation
8.1.1.6 Building & construction
8.1.1.7 Power generation
8.1.1.8 Plumbing
8.1.1.9 Others
Chapter 9. Copper Products Market, By Region
9.1 Overview
9.2 Copper Products Market Revenue Share, By Region 2024 (%)
9.3 Global Copper Products Market, By Region
9.3.1 Market Size and Forecast
9.4 North America
9.4.1 North America Copper Products Market Revenue, 2022-2034 ($Billion)
9.4.2 Market Size and Forecast
9.4.3 North America Copper Products Market, By Country
9.4.4 U.S.
9.4.4.1 U.S. Copper Products Market Revenue, 2022-2034 ($Billion)
9.4.4.2 Market Size and Forecast
9.4.4.3 U.S. Market Segmental Analysis
9.4.5 Canada
9.4.5.1 Canada Copper Products Market Revenue, 2022-2034 ($Billion)
9.4.5.2 Market Size and Forecast
9.4.5.3 Canada Market Segmental Analysis
9.4.6 Mexico
9.4.6.1 Mexico Copper Products Market Revenue, 2022-2034 ($Billion)
9.4.6.2 Market Size and Forecast
9.4.6.3 Mexico Market Segmental Analysis
9.5 Europe
9.5.1 Europe Copper Products Market Revenue, 2022-2034 ($Billion)
9.5.2 Market Size and Forecast
9.5.3 Europe Copper Products Market, By Country
9.5.4 UK
9.5.4.1 UK Copper Products Market Revenue, 2022-2034 ($Billion)
9.5.4.2 Market Size and Forecast
9.5.4.3 UKMarket Segmental Analysis
9.5.5 France
9.5.5.1 France Copper Products Market Revenue, 2022-2034 ($Billion)
9.5.5.2 Market Size and Forecast
9.5.5.3 FranceMarket Segmental Analysis
9.5.6 Germany
9.5.6.1 Germany Copper Products Market Revenue, 2022-2034 ($Billion)
9.5.6.2 Market Size and Forecast
9.5.6.3 GermanyMarket Segmental Analysis
9.5.7 Rest of Europe
9.5.7.1 Rest of Europe Copper Products Market Revenue, 2022-2034 ($Billion)
9.5.7.2 Market Size and Forecast
9.5.7.3 Rest of EuropeMarket Segmental Analysis
9.6 Asia Pacific
9.6.1 Asia Pacific Copper Products Market Revenue, 2022-2034 ($Billion)
9.6.2 Market Size and Forecast
9.6.3 Asia Pacific Copper Products Market, By Country
9.6.4 China
9.6.4.1 China Copper Products Market Revenue, 2022-2034 ($Billion)
9.6.4.2 Market Size and Forecast
9.6.4.3 ChinaMarket Segmental Analysis
9.6.5 Japan
9.6.5.1 Japan Copper Products Market Revenue, 2022-2034 ($Billion)
9.6.5.2 Market Size and Forecast
9.6.5.3 JapanMarket Segmental Analysis
9.6.6 India
9.6.6.1 India Copper Products Market Revenue, 2022-2034 ($Billion)
9.6.6.2 Market Size and Forecast
9.6.6.3 IndiaMarket Segmental Analysis
9.6.7 Australia
9.6.7.1 Australia Copper Products Market Revenue, 2022-2034 ($Billion)
9.6.7.2 Market Size and Forecast
9.6.7.3 AustraliaMarket Segmental Analysis
9.6.8 Rest of Asia Pacific
9.6.8.1 Rest of Asia Pacific Copper Products Market Revenue, 2022-2034 ($Billion)
9.6.8.2 Market Size and Forecast
9.6.8.3 Rest of Asia PacificMarket Segmental Analysis
9.7 LAMEA
9.7.1 LAMEA Copper Products Market Revenue, 2022-2034 ($Billion)
9.7.2 Market Size and Forecast
9.7.3 LAMEA Copper Products Market, By Country
9.7.4 GCC
9.7.4.1 GCC Copper Products Market Revenue, 2022-2034 ($Billion)
9.7.4.2 Market Size and Forecast
9.7.4.3 GCCMarket Segmental Analysis
9.7.5 Africa
9.7.5.1 Africa Copper Products Market Revenue, 2022-2034 ($Billion)
9.7.5.2 Market Size and Forecast
9.7.5.3 AfricaMarket Segmental Analysis
9.7.6 Brazil
9.7.6.1 Brazil Copper Products Market Revenue, 2022-2034 ($Billion)
9.7.6.2 Market Size and Forecast
9.7.6.3 BrazilMarket Segmental Analysis
9.7.7 Rest of LAMEA
9.7.7.1 Rest of LAMEA Copper Products Market Revenue, 2022-2034 ($Billion)
9.7.7.2 Market Size and Forecast
9.7.7.3 Rest of LAMEAMarket Segmental Analysis
Chapter 10. Competitive Landscape
10.1 Competitor Strategic Analysis
10.1.1 Top Player Positioning/Market Share Analysis
10.1.2 Top Winning Strategies, By Company, 2022-2024
10.1.3 Competitive Analysis By Revenue, 2022-2024
10.2 Recent Developments by the Market Contributors (2024)
Chapter 11. Company Profiles
11.1 Wieland Group
11.1.1 Company Snapshot
11.1.2 Company and Business Overview
11.1.3 Financial KPIs
11.1.4 Product/Service Portfolio
11.1.5 Strategic Growth
11.1.6 Global Footprints
11.1.7 Recent Development
11.1.8 SWOT Analysis
11.2 Mueller Industries
11.3 Hailiang Group
11.4 KGHM
11.5 KME Group SpA
11.6 Kobe Steel, Ltd.
11.7 Hindalco Industries Ltd.
11.8 Jiangxi Copper Corporation
11.9 Nexans
11.10 Aurubis AG
11.11 Ningbo Jintian Copper (Group) Co., Ltd.
11.12 Mitsubishi Materials Corporation