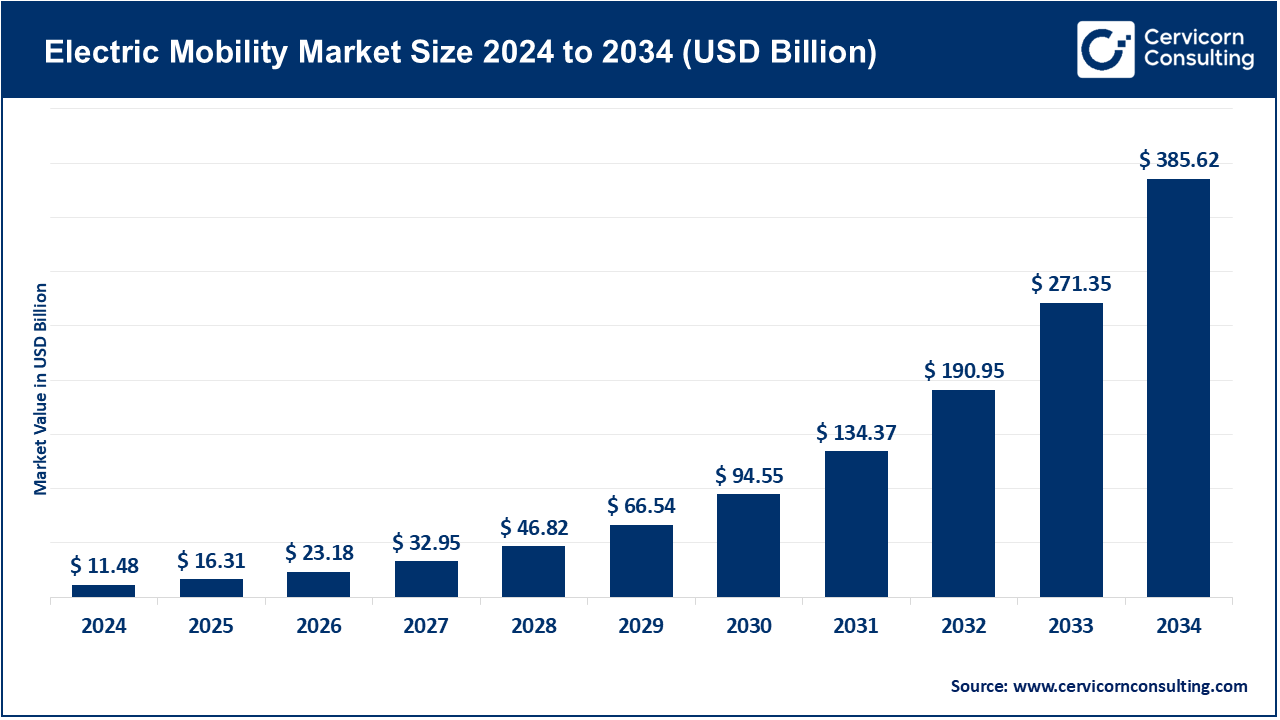
The global electric mobility market size was valued at USD 11.48 billion in 2024 and is expected to be worth around USD 385.62 billion by 2034, growing at a compound annual growth rate (CAGR) of 14.5% over the forecast period from 2025 to 2034. The electric mobility market is witnessing remarkable growth as nations intensify actions to cut down greenhouse gas emissions in the transport sector. Battery electric vehicles (BEVs), plug-in hybrids (PHEVs), and other forms of electric mobility offer the much-needed complement of “zero-emission mobility” in mitigating the dependence on fossil fuels and urban air pollution. The convergence of IoT, AI, and advancements in battery thermal management technologies will continue to evolve the safer and smarter electric vehicles across different use cases which include passenger cars, commercial fleets, and public transport. The adoption of real-time diagnostics, predictive maintenance tools, and other energy management systems will not only drive operational efficiency but also cut down on the cost of operations.

The development of fast charging and vehicle to grid (V2G) systems alongside hybrid charging solutions is revolutionizing performance-oriented sustainability. For instance, government incentives aimed at clean mobility and subsidizing EV adoption stimulate manufactures to invest in next-generation batteries, low-drag materials, and vehicle autonomy. Meanwhile, AI energy management systems, the digital twin concept, and smart fleet systems drive vehicles toward operational autonomy, distance optimization, and energy consumption minimization. EV adoption is highly correlated to reduced carbon emissions and subsequent sustained growth in the highly dynamic electric mobility market is anticipated in the next decade.
Report Scope
| Area of Focus | Details |
| Market Size in 2025 | USD 16.31 Billion |
| Estimated Market Size in 2034 | USD 385.62 Billion |
| Market CAGR 2025 to 2034 | 14.50% |
| Dominant Region | Asia-Pacific |
| Key Segments | Vehicle Type, Component, Battery, Charging Infrastructure, Application, Region |
| Key Companies | Tesla, BYD, Geely Auto Group, General Motors, Volkswagen Group, BMW Group, Hyundai Motor Company, Li Auto, XPeng, Stellantis |
The electric mobility market is segmented into several key regions: North America, Europe, Asia-Pacific, and LAMEA (Latin America, Middle East, and Africa). Here’s an in-depth look at each region.

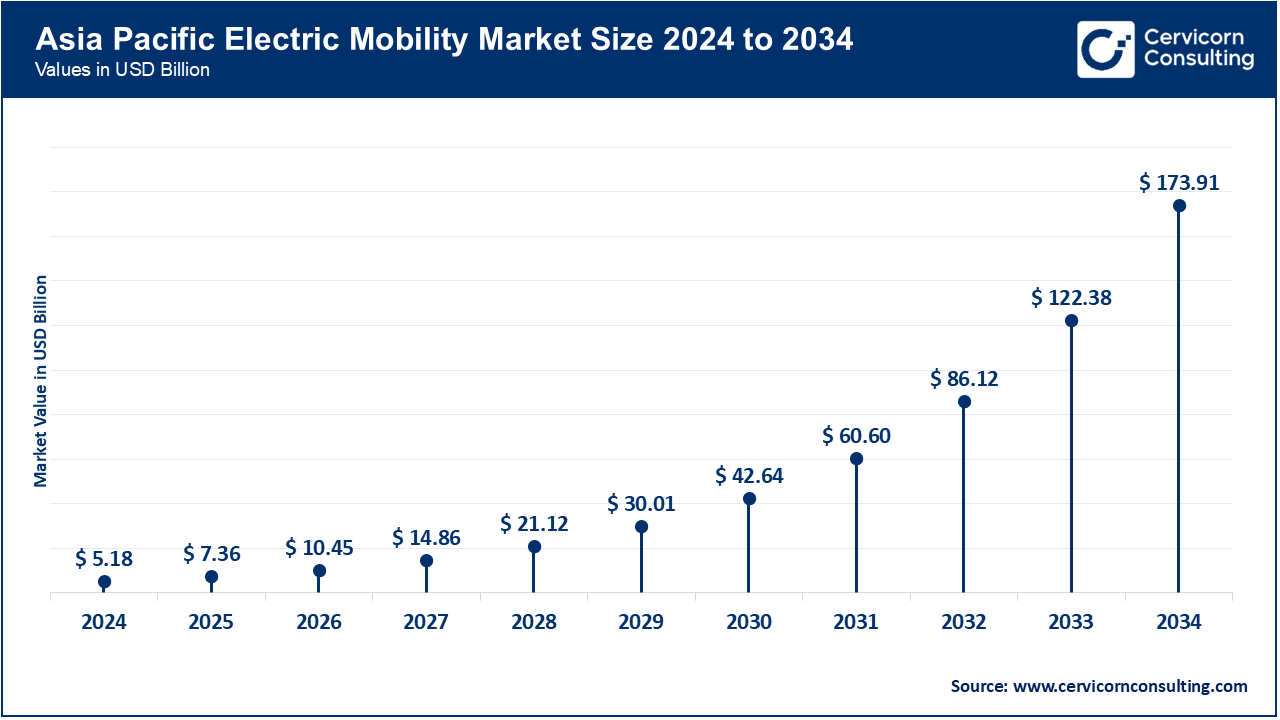
Asia-pacific is the fastest-growing region because of rapid urbanization and industrialization in the region, along with strong government support for zero-emission transportation. China, Japan, India, and South Korea have advanced in the EV supply chain, including battery manufacturing, power electronics, and design for lightweight vehicles. China launched over 3 million new electric two-wheelers and commercial EVs by mid 2025, which is backed by public charging networks and battery-swapping networks. China and other Asia-pacific governments are providing incentives for EV adoption and are localizing battery cell production to lower dependence on imports. The region's electric vehicles (EVs) market is growing 12% each year. Asia-pacific diversified partnerships with global energy and tech companies to support electric mobility innovation and deployment have made the region the most dynamic in the world.
North America is the largest market and this is attributable to the region's advanced technologies, significant industries, and the first adoption of electric mobility technologies. The U.S. and Canada implemented AI technologies that use robotics, digital twins, and smart assembly systems to automate more than 65% of EV manufacturing. This greatly decreased errors and waste in EV manufacturing. The rapid adoption of EVs was fueled by the installation of fast charging stations, with 2 million public charging stations available by mid-2025. Leading manufacturers, including Tesla, Ford, and GM, are making substantial investments in solid-state battery technologies and AI-powered energy management systems. The introduction of EV tax credits, coupled with the integration of renewable energy sources, further advanced the region’s electric mobility innovation and green sustainability. This made North America the most preeminent region in the world.
Europe hits significant growth in the market. This is due to the continent's emission reduction innovations and the European Union's goal for carbon neutrality by 2050. Countries like Germany, France, and the U.K. have built renewable-powered gigafactories that use electric arc furnaces and smart automation for the production of EV components. Production is expected to increase by 20% annually since 2024. European OEMs such as Volkswagen, Renault, and BMW are leading the development of next-gen electric and plug-in hybrids for urban and long-distance travel. Europe will also lead the world by having over 1.5 million EVs in public and commercial fleets by early 2025. Europe is expanding public infrastructure that supports EVs and V2G systems, which help to balance the grid. Europe’s emphasis on sustainability and energy efficiency in mobility evolution is unparalleled.
Electric Mobility Market Share, By Region, 2024 (%)
| Region | Revenue Share, 2024 (%) |
| North America | 21.40% |
| Europe | 28.70% |
| Asia-Pacific | 45.10% |
| LAMEA | 4.80% |
The LAMEA region is gaining attention, prompted by sustainability projects, smart city initiatives, and the building of sustainable infrastructures. The countries of Brazil, Mexico, Saudi Arabia, and the UAE are enhancing their industrial capabilities with automated assembly lines and AI-driven power electronics to manufacture EVs. Under government-sponsored green range fores, pilot deployments of electric buses, delivery EVs, and industrial EVs were started in the big cities by the middle of 2025. The rapid adoption of EVs in urban and rural areas are the result of localized battery recycling plants and solar-powered charging stations. Due to advances in clean energy and grid infrastructure, the LAMEA region is expected to grow steadily in the market from 2026 to 2028, indicating a strategic market shift to sustainable, electrified transport ecosystems.
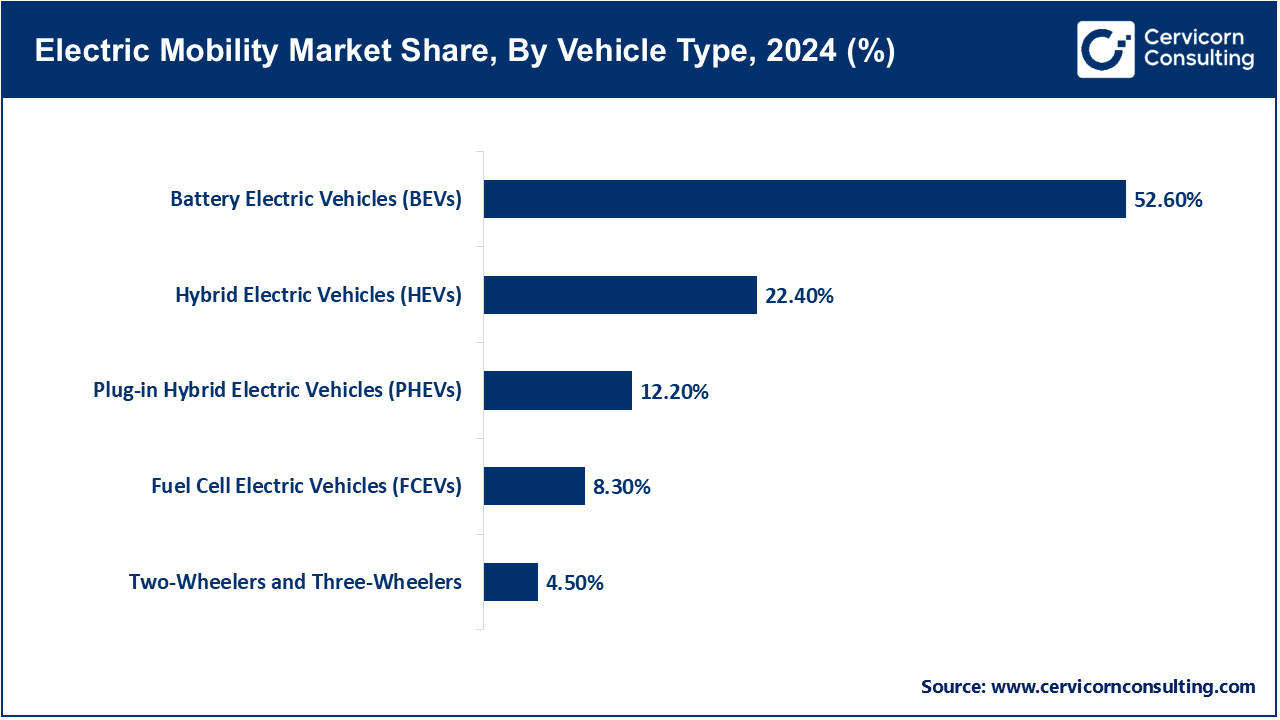
Battery Electric Vehicles (BEVs): Battery Electric Vehicles use rechargeable batteries and electric motors, so they have no tailpipe emissions and can almost eliminate carbon footprints. BEVs have become the preferred subtype of electric vehicles. This is due to the advances made in the extraction industry of high-density lithium-ion batteries and the introduction of solid-state batteries, which enhance EV range and performance. Fast-charging networks have improved charging convenience for EV Owners. Tesla and BYD together reported 4.3 million BEV sales across the globe in the first half of 2025, a 38% annual increase, with the Tesla Model 2 and BYD Seal U gaining popularity in Europe and Asia.
Plug-in Hybrid Electric Vehicles (PHEVs): Plug-in Hybrid Electric Vehicles have an internal combustion engine and a rechargeable battery, so they can switch between electric and hybrid driving. This flexibility eases range anxiety for customers. Plug-in Hybrids have become a legislators target for fiscal measures, likely due to the emissions reductions associated with their operation. As of April in 2025, BMW and Mercedes-Benz noted a 20% rise in PHEV sales in Europe, likely a result of the European Union’s clean vehicle policies and the increasing consumer preference for vehicles with better fuel efficiency.

Hybrid Electric Vehicles (HEVs): Hybrid Electric Vehicles (HEVs) combine traditional combustion engines and electric motors. These vehicles reduce fuel use and emissions without having to externally charge. HEVs are popular during the gradual transition to full electrification. As of March 2025, Toyota’s hybrids, the Corolla and RAV4 hybrids, marked 25 million cumulative global sales. This reaffirms the reliability of hybrids as a transition to electric mobility.
Fuel Cell Electric Vehicles (FCEVs): FCEVs are the cleanest vehicles today, as they produce only water vapor and no toxic fumes. FCEVs are praised for their long driving range and fast refueling capabilities, making them popular in the commercial and fleet driving sector. Investing in hydrogen fuel for vehicles makes them far easier to apply in everyday use. As of June 2025, Hyundai Motor Group’s NEXO SUV production will reach 50,000 units a year, pointing to a developed market and interest in hydrogen fuel infrastructure. This signals interest in hydrogen-driven mobility solutions in North America and Europe.
Battery-Powered motorcycles and Tricycles: Battery-powered motorcycles and tricycles change urban commuting, providing low-cost, effective, and eco-friendly options. Transforming urban mobility, they are especially important for the Asia–Pacific region's densely populated and short-distance-traveling areas. Population density, short-distance traveling, and government policies create a mobility landscape. Ola Electric and Hero MotoCorp reported over a million sales in February, and shows the increased sales in environmentally friendly commuting options.
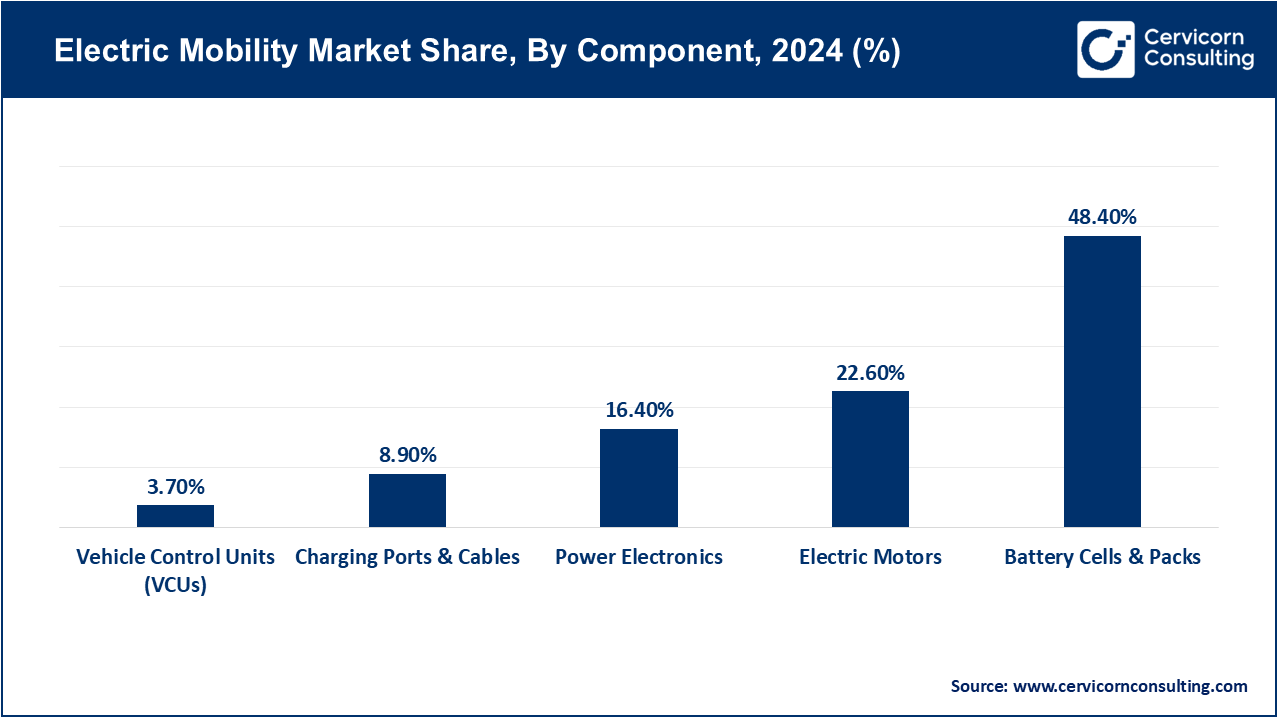
Battery Cells & Packs: The storage and supply of operational energy is the main function of the batteries of an electric vehicle. They are cost determining components and influence an electric vehicle’s range, charging speed, and performance overall. Innovations involving LFP and solid state batteries are aiming at faster charging and longer lifespans. In July 2025, CATL set a global benchmark for fast charging EV batteries with the 700 km range Shenxing Plus LFP battery which charges 600 km in 10 minutes.
Electric Motors: Electric motors provide instantaneous torque and smoother acceleration due to the conversion of electric power into mechanical power. Internal combustion engines cannot match the torque and acceleration of electric motors. Compact motor designs are being developed to improve efficiency and performance. Most auto manufacturers are rushing to meet the global demand for electric vehicles. In 2025 Poland, Nidec Corporation advanced the capabilities of its E-Axle facility to promote the growth of Europe’s electric vehicles.

Power Electronics (Inverters, Converters, and Controllers): Power Electronics plays a pivotal role in overseeing the efficiency and thermal characteristics of systems involving batteries, motors, and power systems, including the charging systems. The industry transition to silicon carbide (SiC) technology improves power density and switching speeds. As of April 2025, Infineon Technologies released new versions of SiC power modules that are 10% more energy efficient tailored for electric vehicle platforms, improving the performance of both passenger and commercial electric vehicles.
Charging Ports and Cables: The safe and efficient transfer of charge to electric vehicles depends on the quality of the charging ports and cables which are core components in the charging system. The reliability, safety, and speed of charging an electric vehicle all depend on the quality and compatibility of the components. The industry has started working on universal connectors to make charging systems more universal. In March 2025, ABB E-mobility introduced modular, flexible connectors designed to work with multiple electric vehicle models, improving convenience within the global charging landscape.
Vehicle Control Units (VCUs): VCUs perform the primary communication and control functions. They oversee the distribution of power, battery management, and handling of all system diagnostics. New AI integration allows for predictive maintenance and energy consumption improvements. AI-based VCUs, which perform real-time data analysis and dynamic performance control, were released by Bosch in June 2025. This revolutionary device augmented the safety, efficiency, and dependability of next-generation EVs.
AC Charging (Slow/Level 1 & 2): Residential and workplace charging uses AC chargers, providing safe and reliable overnight charging at cost-affordable rates. While AC chargers do take longer to charge, they are optimal for daily charging needs. Smart AC chargers and networked AC chargers are becoming commercially available for both private users and fleets, improving accessibility. Siemens installed over 500,000 Level 2 AC chargers from 2021 to 2025, helping build foundational EV infrastructure in key markets throughout the United States and the European Union.
DC Fast Charging (Level 3): DC fast chargers provide high-voltage direct current to EV batteries, allowing charging to go from hours to minutes. They are essential for long-distance travel and for the operations of commercial fleets. Charging convenience is increasing due to ongoing improvements in charger capacity and efficiency. In April 2025, Tesla enhanced its global charging network by introducing 10,000 Supercharger V4 stations across North America and Europe, providing 50% faster charging than the V3 stations.
Electric Mobility Market Share, By Charging Infrastructure, 2024 (%)
| Charging Infrastructure | Revenue Share, 2024 (%) |
| AC Charging (Slow/Level 1 & 2) | 26.70% |
| DC Fast Charging (Level 3) | 44.90% |
| Wireless Charging | 9.40% |
| Battery Swapping Stations | 14.70% |
| Vehicle-to-Grid (V2G) Systems | 4.30% |
Wireless Charging: Wireless or inductive charging allows for contactless power transfer with the aid of magnetic fields. There is no need for charging cables. It is used more and more in public transport and fleet operations, where charging is automated and can be done quickly. In June 2023, WiTricity worked with Stellantis in the deployment of the first wireless charging systems for EV taxis in Paris. This system shows the viability of automated frequent charging in cities.
Battery Swapping Stations: Battery swapping addresses the problem of long charging times. Fleets and shared mobility services, which need their vehicles to be operational for long periods, can benefit from the time saved. NIO expanded their battery swapping network to 2,500 stations globally, and in March 2023, they completed 45 million swaps. This dramatically improved the operational efficiency of electric taxis and Mpesa ride-hailing services, which are now available 24/7.
Vehicle to Grid (V2G) Systems: V2G systems allow two-way energy flow and the transfer of stored energy EVs have back to the grid for use during peak times. This system enables the use of vehicles as mobil energy assets. By July 2023, Japan and the Netherlands launched large-scale V2G projects with Nissan, integrating over 10,000 EVs to the system. These vehicles are used for load balancing and grid backup during peak times, showcasing a seamless smart grid V2G system.
Passenger Cars: The growth of passenger electric cars is leading the world in EV adoption. This is due to innovative technology, decreasing costs of batteries, and the adoption of EVs in policy frameworks. With the goal of attracting a wider audience, auto manufacturers are making electric cars more affordable and increasing the range of vehicles. By June 2025, BYD's passenger EV sales hit 3 million units worldwide, surpassing Tesla in Asia and making electric cars more attainable in developed and developing markets.
Commercial Vehicles (Light, Medium, Heavy): The introduction of electric vehicles into the world of logistics and freight transforms the industry with offers of quieter, cleaner, and more efficient transportation. Improvements in range, charge speed, and the ability to carry more freight make these vehicles easily usable for urban and regional delivery systems. In May 2025, Volvo Trucks successfully delivered 2000 electric heavy-duty trucks to use throughout Europe, and these trucks are capable of decreasing operational emissions by 45%, a first in decarbonized freight transportation.
Public Transport (Buses, Vans): The use of electric vans and buses in public transport generates efficient, zero-emission operations and diminished maintenance expenses. Globally, cities are adopting electric fleets to align with emission standards and improve the overall air quality. As of April 2025, China's electric bus fleet surpassed 600,000 units, accounting for over 70% of the world's electric buses and proving their position as the leader in sustainable urban mobility.
Electric Mobility Market Share, By Application, 2024 (%)
| Application | Revenue Share, 2024 (%) |
| Passenger Cars | 47.20% |
| Commercial Vehicles (Light, Medium, Heavy) | 19.70% |
| Public Transport (Buses, Vans) | 14.80% |
| Industrial Vehicles | 10.30% |
| Last-Mile Delivery and Fleet Services | 8% |
Industrial Vehicles (Material Handling, Mining, Construction): Industrial electric vehicles are improving energy efficiency and decreasing pollution in heavy industries. They are becoming more common in warehouses, construction, and mining. Because of their durability and power, these vehicles are necessary. Komatsu introduced their first prototype fully electric mining dump truck in Australia in March 2025. This dump truck helped demonstrate the feasibility of zero-emission mining operations and reduced energy costs by 40%.
Last-Mile Delivery and Fleet Services: Electric vehicles are transforming last-mile delivery by providing low-cost, sustainable alternatives to diesel fleets. With the rise of e-commerce, businesses are investing in electric vehicle fleets to achieve their sustainability goals. In May 2025, Amazon's electric delivery fleet reached over 20,000 vehicles globally, resulting in 25% reduced carbon emissions per 2022 delivery, and marking a turnaround in the company's delivery fleet emissions.
Market Segmentation
By Vehicle Type
By Component
By Battery
By Charging Infrastructure
By Application
By Region
Chapter 1. Market Introduction and Overview
1.1 Market Definition and Scope
1.1.1 Overview of Electric Mobility
1.1.2 Scope of the Study
1.1.3 Research Timeframe
1.2 Research Methodology and Approach
1.2.1 Methodology Overview
1.2.2 Data Sources and Validation
1.2.3 Key Assumptions and Limitations
Chapter 2. Executive Summary
2.1 Market Highlights and Snapshot
2.2 Key Insights by Segments
2.2.1 By Vehicle Type Overview
2.2.2 By Component Overview
2.2.3 By Charging Infrastructure Overview
2.2.4 By Application Overview
2.2.5 By Battery Overview
2.3 Competitive Overview
Chapter 3. Global Impact Analysis
3.1 Russia-Ukraine Conflict: Global Market Implications
3.2 Regulatory and Policy Changes Impacting Global Markets
Chapter 4. Market Dynamics and Trends
4.1 Market Dynamics
4.1.1 Market Drivers
4.1.1.1 Government Policies and Incentives
4.1.1.2 Charging Infrastructure Expansion
4.1.1.3 Heavy-Duty and Commercial Applications
4.1.2 Market Restraints
4.1.2.1 Battery Costs and Material Supply
4.1.2.2 Infrastructure Gaps
4.1.2.3 Regulatory Variability
4.1.3 Market Challenges
4.1.3.1 Competing Low-Emission Vehicles
4.1.3.2 Barriers to Technological Integration
4.1.4 Market Opportunities
4.1.4.1 Renewable Energy Integration with Smart Grids
4.1.4.2 Sustainability and the Circular Economy
4.1.4.3 Growth of Emerging Markets
4.2 Market Trends
Chapter 5. Premium Insights and Analysis
5.1 Global Electric Mobility Market Dynamics, Impact Analysis
5.2 Porter’s Five Forces Analysis
5.2.1 Bargaining Power of Suppliers
5.2.2 Bargaining Power of Buyers
5.2.3 Threat of Substitute Products
5.2.4 Rivalry among Existing Firms
5.2.5 Threat of New Entrants
5.3 PESTEL Analysis
5.4 Value Chain Analysis
5.5 Product Pricing Analysis
5.6 Vendor Landscape
5.6.1 List of Buyers
5.6.2 List of Suppliers
Chapter 6. Electric Mobility Market, By Vehicle Type
6.1 Global Electric Mobility Market Snapshot, By Vehicle Type
6.1.1 Market Revenue (($Billion) and Growth Rate (%), 2022-2034
6.1.1.1 Battery Electric Vehicles (BEVs)
6.1.1.2 Plug-in Hybrid Electric Vehicles (PHEVs)
6.1.1.3 Hybrid Electric Vehicles (HEVs)
6.1.1.4 Fuel Cell Electric Vehicles (FCEVs)
6.1.1.5 Two-Wheelers and Three-Wheelers
Chapter 7. Electric Mobility Market, By Component
7.1 Global Electric Mobility Market Snapshot, By Component
7.1.1 Market Revenue (($Billion) and Growth Rate (%), 2022-2034
7.1.1.1 Battery Cells & Packs
7.1.1.2 Electric Motors
7.1.1.3 Power Electronics (Inverters, Converters, Controllers)
7.1.1.4 Charging Ports & Cables
7.1.1.5 Vehicle Control Units (VCUs)
Chapter 8. Electric Mobility Market, By Charging Infrastructure
8.1 Global Electric Mobility Market Snapshot, By Charging Infrastructure
8.1.1 Market Revenue (($Billion) and Growth Rate (%), 2022-2034
8.1.1.1 AC Charging (Slow/Level 1 & 2)
8.1.1.2 DC Fast Charging (Level 3)
8.1.1.3 Wireless Charging
8.1.1.4 Battery Swapping Stations
8.1.1.5 Vehicle-to-Grid (V2G) Systems
Chapter 9. Electric Mobility Market, By Application
9.1 Global Electric Mobility Market Snapshot, By Application
9.1.1 Market Revenue (($Billion) and Growth Rate (%), 2022-2034
9.1.1.1 Passenger Cars
9.1.1.2 Commercial Vehicles (Light, Medium, Heavy)
9.1.1.3 Public Transport (Buses, Vans)
9.1.1.4 Industrial Vehicles (Material Handling, Mining, Construction)
9.1.1.5 Last-Mile Delivery and Fleet Services
Chapter 10. Electric Mobility Market, By Battery
10.1 Global Electric Mobility Market Snapshot, By Battery
10.1.1 Market Revenue (($Billion) and Growth Rate (%), 2022-2034
10.1.1.1 Lead Acid Battery
10.1.1.2 Li-Ion Battery
10.1.1.3 Others
Chapter 11. Electric Mobility Market, By Region
11.1 Overview
11.2 Electric Mobility Market Revenue Share, By Region 2024 (%)
11.3 Global Electric Mobility Market, By Region
11.3.1 Market Size and Forecast
11.4 North America
11.4.1 North America Electric Mobility Market Revenue, 2022-2034 ($Billion)
11.4.2 Market Size and Forecast
11.4.3 North America Electric Mobility Market, By Country
11.4.4 U.S.
11.4.4.1 U.S. Electric Mobility Market Revenue, 2022-2034 ($Billion)
11.4.4.2 Market Size and Forecast
11.4.4.3 U.S. Market Segmental Analysis
11.4.5 Canada
11.4.5.1 Canada Electric Mobility Market Revenue, 2022-2034 ($Billion)
11.4.5.2 Market Size and Forecast
11.4.5.3 Canada Market Segmental Analysis
11.4.6 Mexico
11.4.6.1 Mexico Electric Mobility Market Revenue, 2022-2034 ($Billion)
11.4.6.2 Market Size and Forecast
11.4.6.3 Mexico Market Segmental Analysis
11.5 Europe
11.5.1 Europe Electric Mobility Market Revenue, 2022-2034 ($Billion)
11.5.2 Market Size and Forecast
11.5.3 Europe Electric Mobility Market, By Country
11.5.4 UK
11.5.4.1 UK Electric Mobility Market Revenue, 2022-2034 ($Billion)
11.5.4.2 Market Size and Forecast
11.5.4.3 UKMarket Segmental Analysis
11.5.5 France
11.5.5.1 France Electric Mobility Market Revenue, 2022-2034 ($Billion)
11.5.5.2 Market Size and Forecast
11.5.5.3 FranceMarket Segmental Analysis
11.5.6 Germany
11.5.6.1 Germany Electric Mobility Market Revenue, 2022-2034 ($Billion)
11.5.6.2 Market Size and Forecast
11.5.6.3 GermanyMarket Segmental Analysis
11.5.7 Rest of Europe
11.5.7.1 Rest of Europe Electric Mobility Market Revenue, 2022-2034 ($Billion)
11.5.7.2 Market Size and Forecast
11.5.7.3 Rest of EuropeMarket Segmental Analysis
11.6 Asia Pacific
11.6.1 Asia Pacific Electric Mobility Market Revenue, 2022-2034 ($Billion)
11.6.2 Market Size and Forecast
11.6.3 Asia Pacific Electric Mobility Market, By Country
11.6.4 China
11.6.4.1 China Electric Mobility Market Revenue, 2022-2034 ($Billion)
11.6.4.2 Market Size and Forecast
11.6.4.3 ChinaMarket Segmental Analysis
11.6.5 Japan
11.6.5.1 Japan Electric Mobility Market Revenue, 2022-2034 ($Billion)
11.6.5.2 Market Size and Forecast
11.6.5.3 JapanMarket Segmental Analysis
11.6.6 India
11.6.6.1 India Electric Mobility Market Revenue, 2022-2034 ($Billion)
11.6.6.2 Market Size and Forecast
11.6.6.3 IndiaMarket Segmental Analysis
11.6.7 Australia
11.6.7.1 Australia Electric Mobility Market Revenue, 2022-2034 ($Billion)
11.6.7.2 Market Size and Forecast
11.6.7.3 AustraliaMarket Segmental Analysis
11.6.8 Rest of Asia Pacific
11.6.8.1 Rest of Asia Pacific Electric Mobility Market Revenue, 2022-2034 ($Billion)
11.6.8.2 Market Size and Forecast
11.6.8.3 Rest of Asia PacificMarket Segmental Analysis
11.7 LAMEA
11.7.1 LAMEA Electric Mobility Market Revenue, 2022-2034 ($Billion)
11.7.2 Market Size and Forecast
11.7.3 LAMEA Electric Mobility Market, By Country
11.7.4 GCC
11.7.4.1 GCC Electric Mobility Market Revenue, 2022-2034 ($Billion)
11.7.4.2 Market Size and Forecast
11.7.4.3 GCCMarket Segmental Analysis
11.7.5 Africa
11.7.5.1 Africa Electric Mobility Market Revenue, 2022-2034 ($Billion)
11.7.5.2 Market Size and Forecast
11.7.5.3 AfricaMarket Segmental Analysis
11.7.6 Brazil
11.7.6.1 Brazil Electric Mobility Market Revenue, 2022-2034 ($Billion)
11.7.6.2 Market Size and Forecast
11.7.6.3 BrazilMarket Segmental Analysis
11.7.7 Rest of LAMEA
11.7.7.1 Rest of LAMEA Electric Mobility Market Revenue, 2022-2034 ($Billion)
11.7.7.2 Market Size and Forecast
11.7.7.3 Rest of LAMEAMarket Segmental Analysis
Chapter 12. Competitive Landscape
12.1 Competitor Strategic Analysis
12.1.1 Top Player Positioning/Market Share Analysis
12.1.2 Top Winning Strategies, By Company, 2022-2024
12.1.3 Competitive Analysis By Revenue, 2022-2024
12.2 Recent Developments by the Market Contributors (2024)
Chapter 13. Company Profiles
13.1 Tesla
13.1.1 Company Snapshot
13.1.2 Company and Business Overview
13.1.3 Financial KPIs
13.1.4 Product/Service Portfolio
13.1.5 Strategic Growth
13.1.6 Global Footprints
13.1.7 Recent Development
13.1.8 SWOT Analysis
13.2 BYD
13.3 Geely Auto Group
13.4 General Motors
13.5 Volkswagen Group
13.6 BMW Group
13.7 Hyundai Motor Company
13.8 Li Auto
13.9 XPeng
13.10 Stellantis