
Content
China vs. U.S. in Physical AI: Two Superpowers, Two Very Different Advantages


Why Physical AI Has Become a Strategic Contest
Physical AI refers to intelligence that acts in the real world: robots on factory floors, autonomous vehicles, warehouse systems, drones and humanoid machines. Software-only AI can be copied across borders in days. A robot needs motors, sensors, batteries, factories and years of field data, which makes leadership far harder to dislodge once it is established.
That is why the competition between Beijing and Washington looks different here than in chatbots. The question is no longer who has the smartest model. It is who can put capable machines into the most workplaces, at the lowest cost, with the most reliable performance.
Key Takeaways
- China installed about 295,000 industrial robots in 2024, roughly 54% of the global total, against about 34,200 in the United States.
- The U.S. drew $109.1 billion in private AI investment in 2024, nearly twelve times China's $9.3 billion.
- China's advantage is deployment scale and supply chain depth. The U.S. advantage is capital, chips and frontier models.
- Neither side can win alone. Physical AI needs software, hardware and data to arrive together.
The Scoreboard: Key Indicators at a Glance
| Indicator | China | United States |
| Industrial robot installations (2024) | 295,000 | 34,200 |
| Share of global installations (2024) | 54% | 6% |
| Robot density (per 10,000 workers) (2023) | 470 | 295 |
| Private AI investment (2024) | $9.3 Billion | $109.1 Billion |
| Notable AI models released (2024) | 15 | 40 |
| Share of global manufacturing output (2023) | 29% | 17% |
China: Winning on Scale, Speed and Supply Chains
The factory floor is already automated at scale
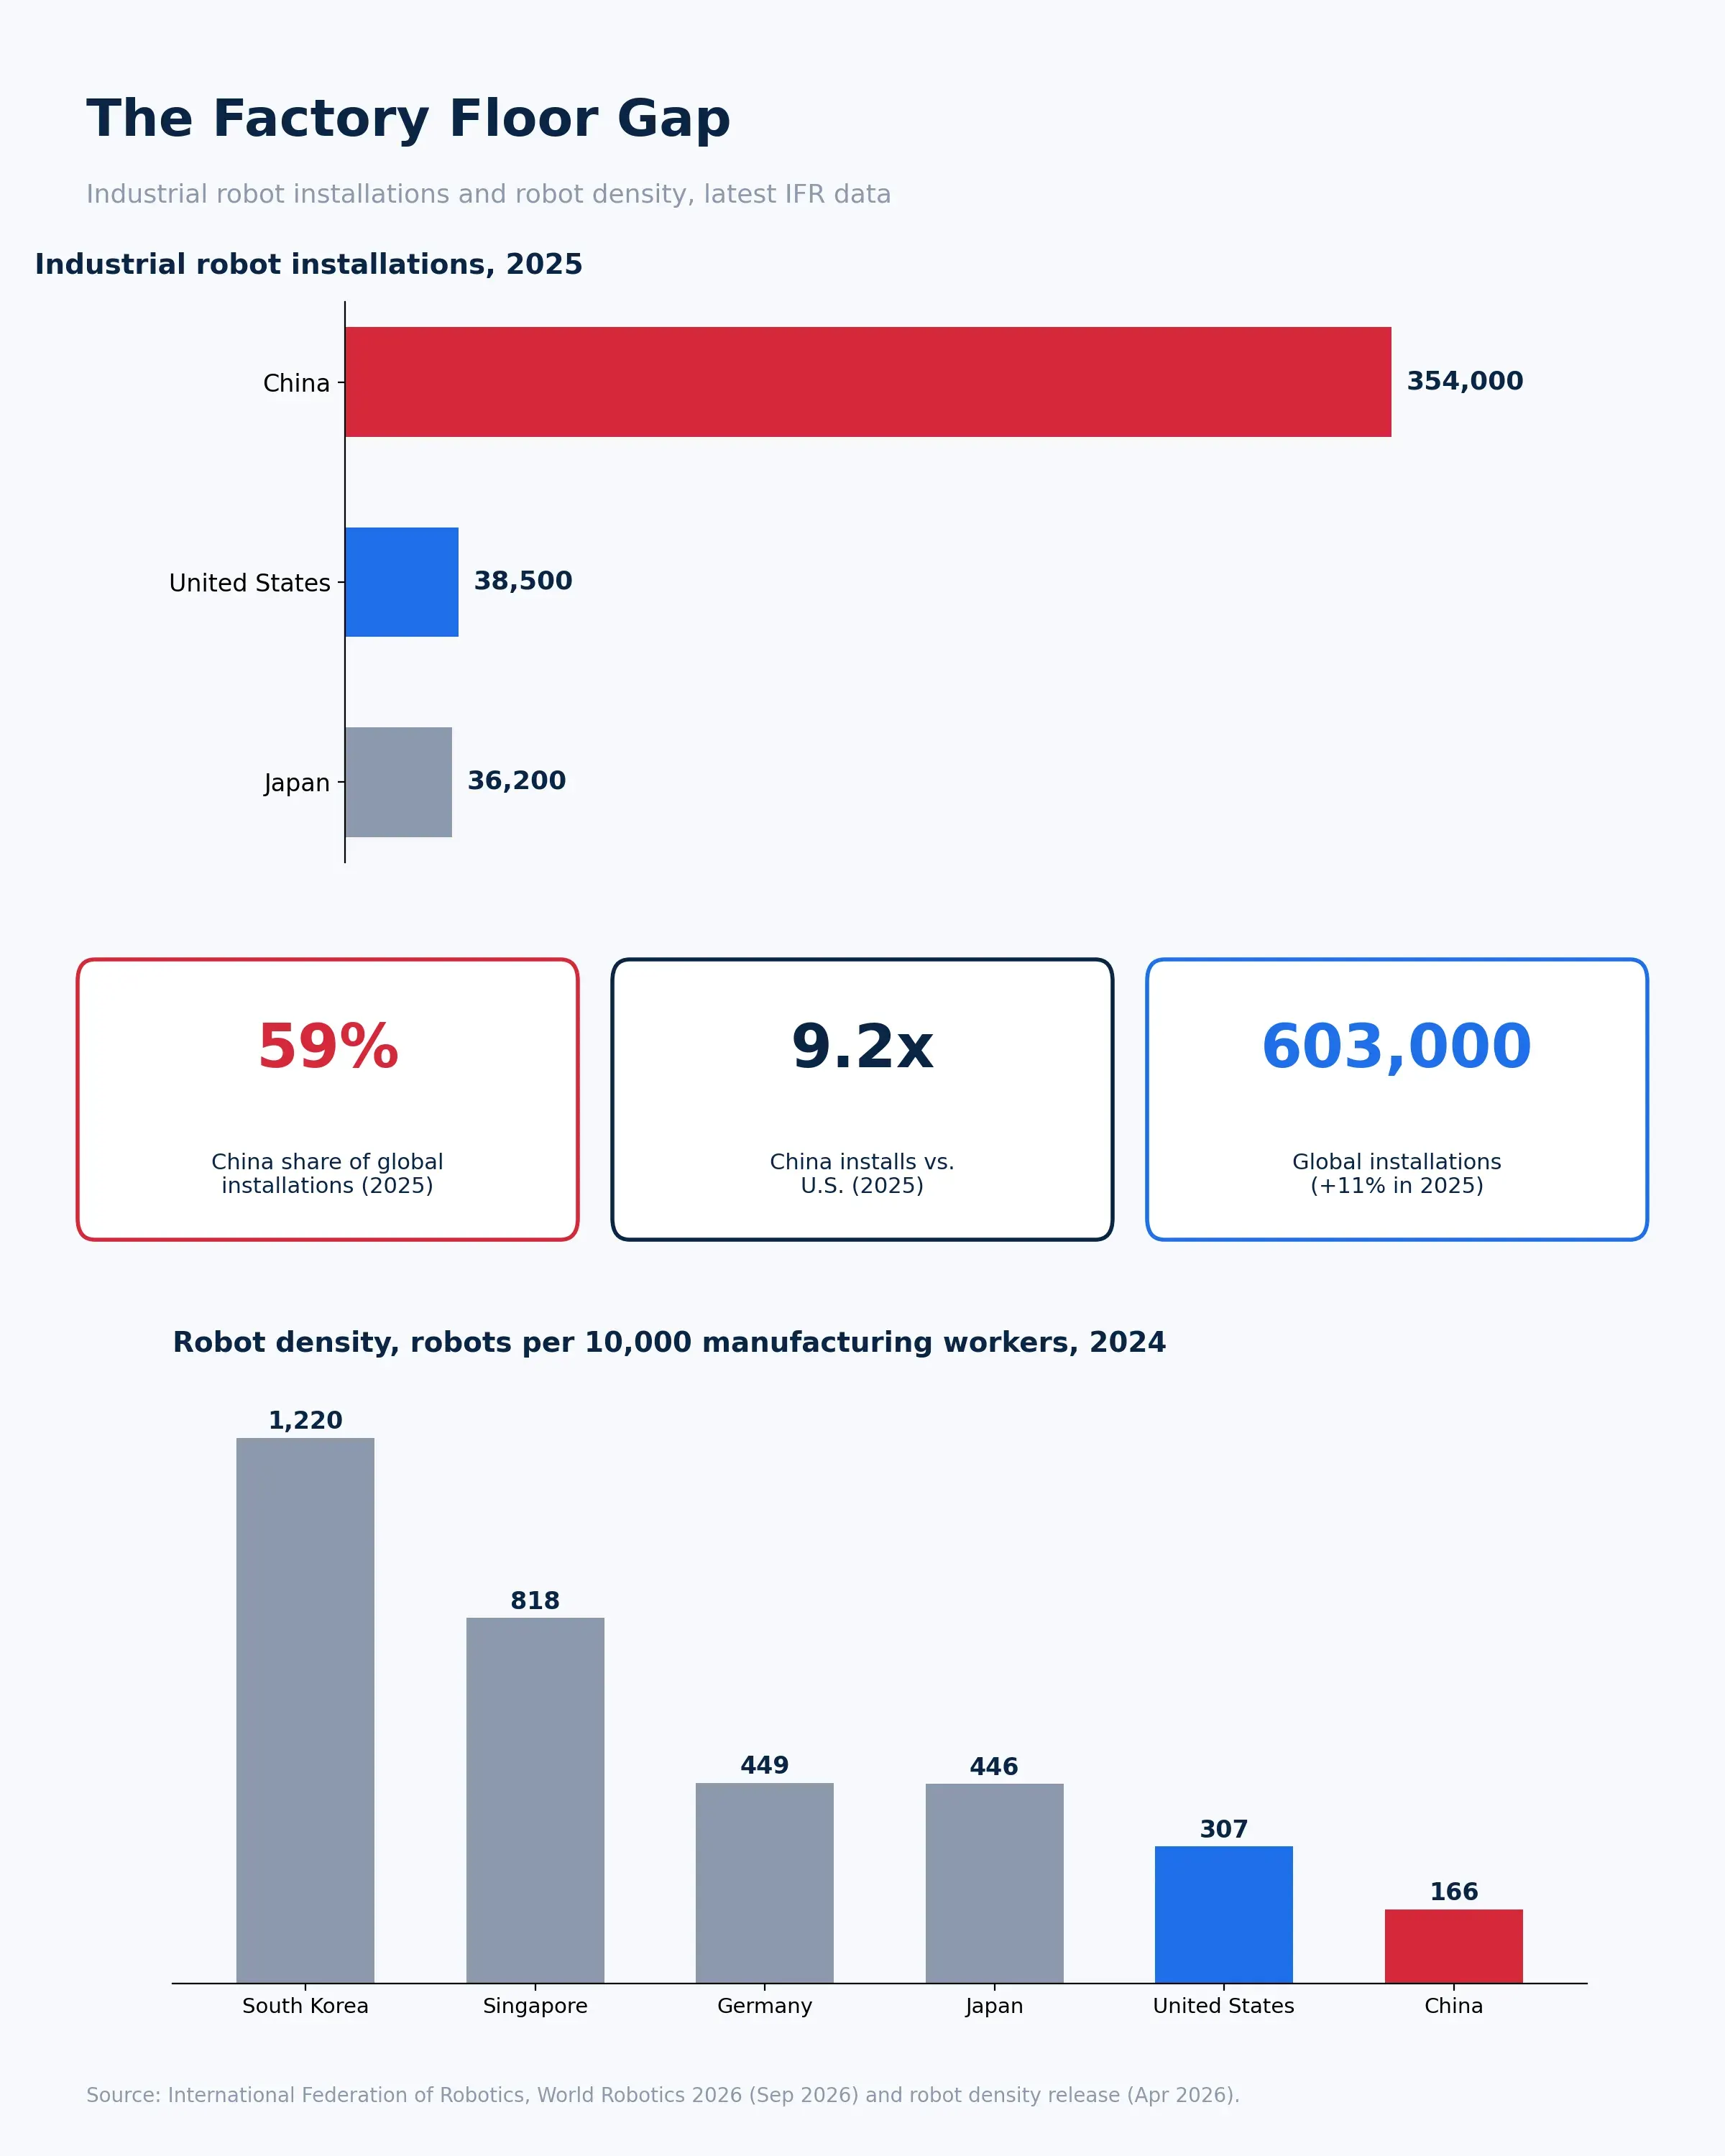
China has been the world's largest industrial robot market for over a decade, and the gap keeps widening. According to the International Federation of Robotics, Chinese factories installed 354,000 units in 2025, up 20% and almost 60,000 above the previous record. That is more than nine times the U.S. figure.
Domestic suppliers are gaining ground at home. Chinese brands sold about 195,000 of the robots installed in China in 2025, a 55% share of their home market. Electrical and electronics plants took 96,400 units, automakers a record 78,900, and metal and machinery makers 78,700, up 44%.
One nuance matters. After updated labor statistics, the federation revised China's robot density to 166 per 10,000 manufacturing employees for 2024, up 17% year on year. China leads in volume, but its workforce is so large that density per worker still trails the United States.
| Country | Robots per 10,000 manufacturing workers (2024) |
| South Korea | 1,220 |
| Singapore | 818 |
| Germany | 449 |
| Japan | 446 |
| United States | 307 |
| China | 166 |
The table shows why Beijing keeps pushing. A huge gap in density is also a huge runway for further installations, and the federation expects average annual growth of 5% to 10% in the Chinese market.
Government direction with real money behind it
Chinese policy treats embodied intelligence as a national priority. The 15th Five-Year Plan, approved in March 2026, lists embodied AI among its top new industry tracks and names humanoid robots for accelerated deployment. In 2025, authorities announced a national venture guidance fund of 1 trillion yuan, about $138 billion, aimed at robotics, AI and other frontier technologies. The first national standard system covering the humanoid robot lifecycle followed in early 2026.
Local governments add subsidies. Some provinces cover up to 30% of project costs or discount humanoid purchases, and roughly 40 state-backed training centers collect real-world movement data for shared use.
Cost is the weapon
More than 150 Chinese companies now build humanoids, and the competition pushes prices down quickly. Unitree launched its R1 at about $5,900 in 2025, while AgiBot's lowest-cost model starts near $14,500. Western rivals building comparable machines cannot yet approach those figures.
United States: Winning on Capital, Chips and Frontier Models
Money flows to ideas faster
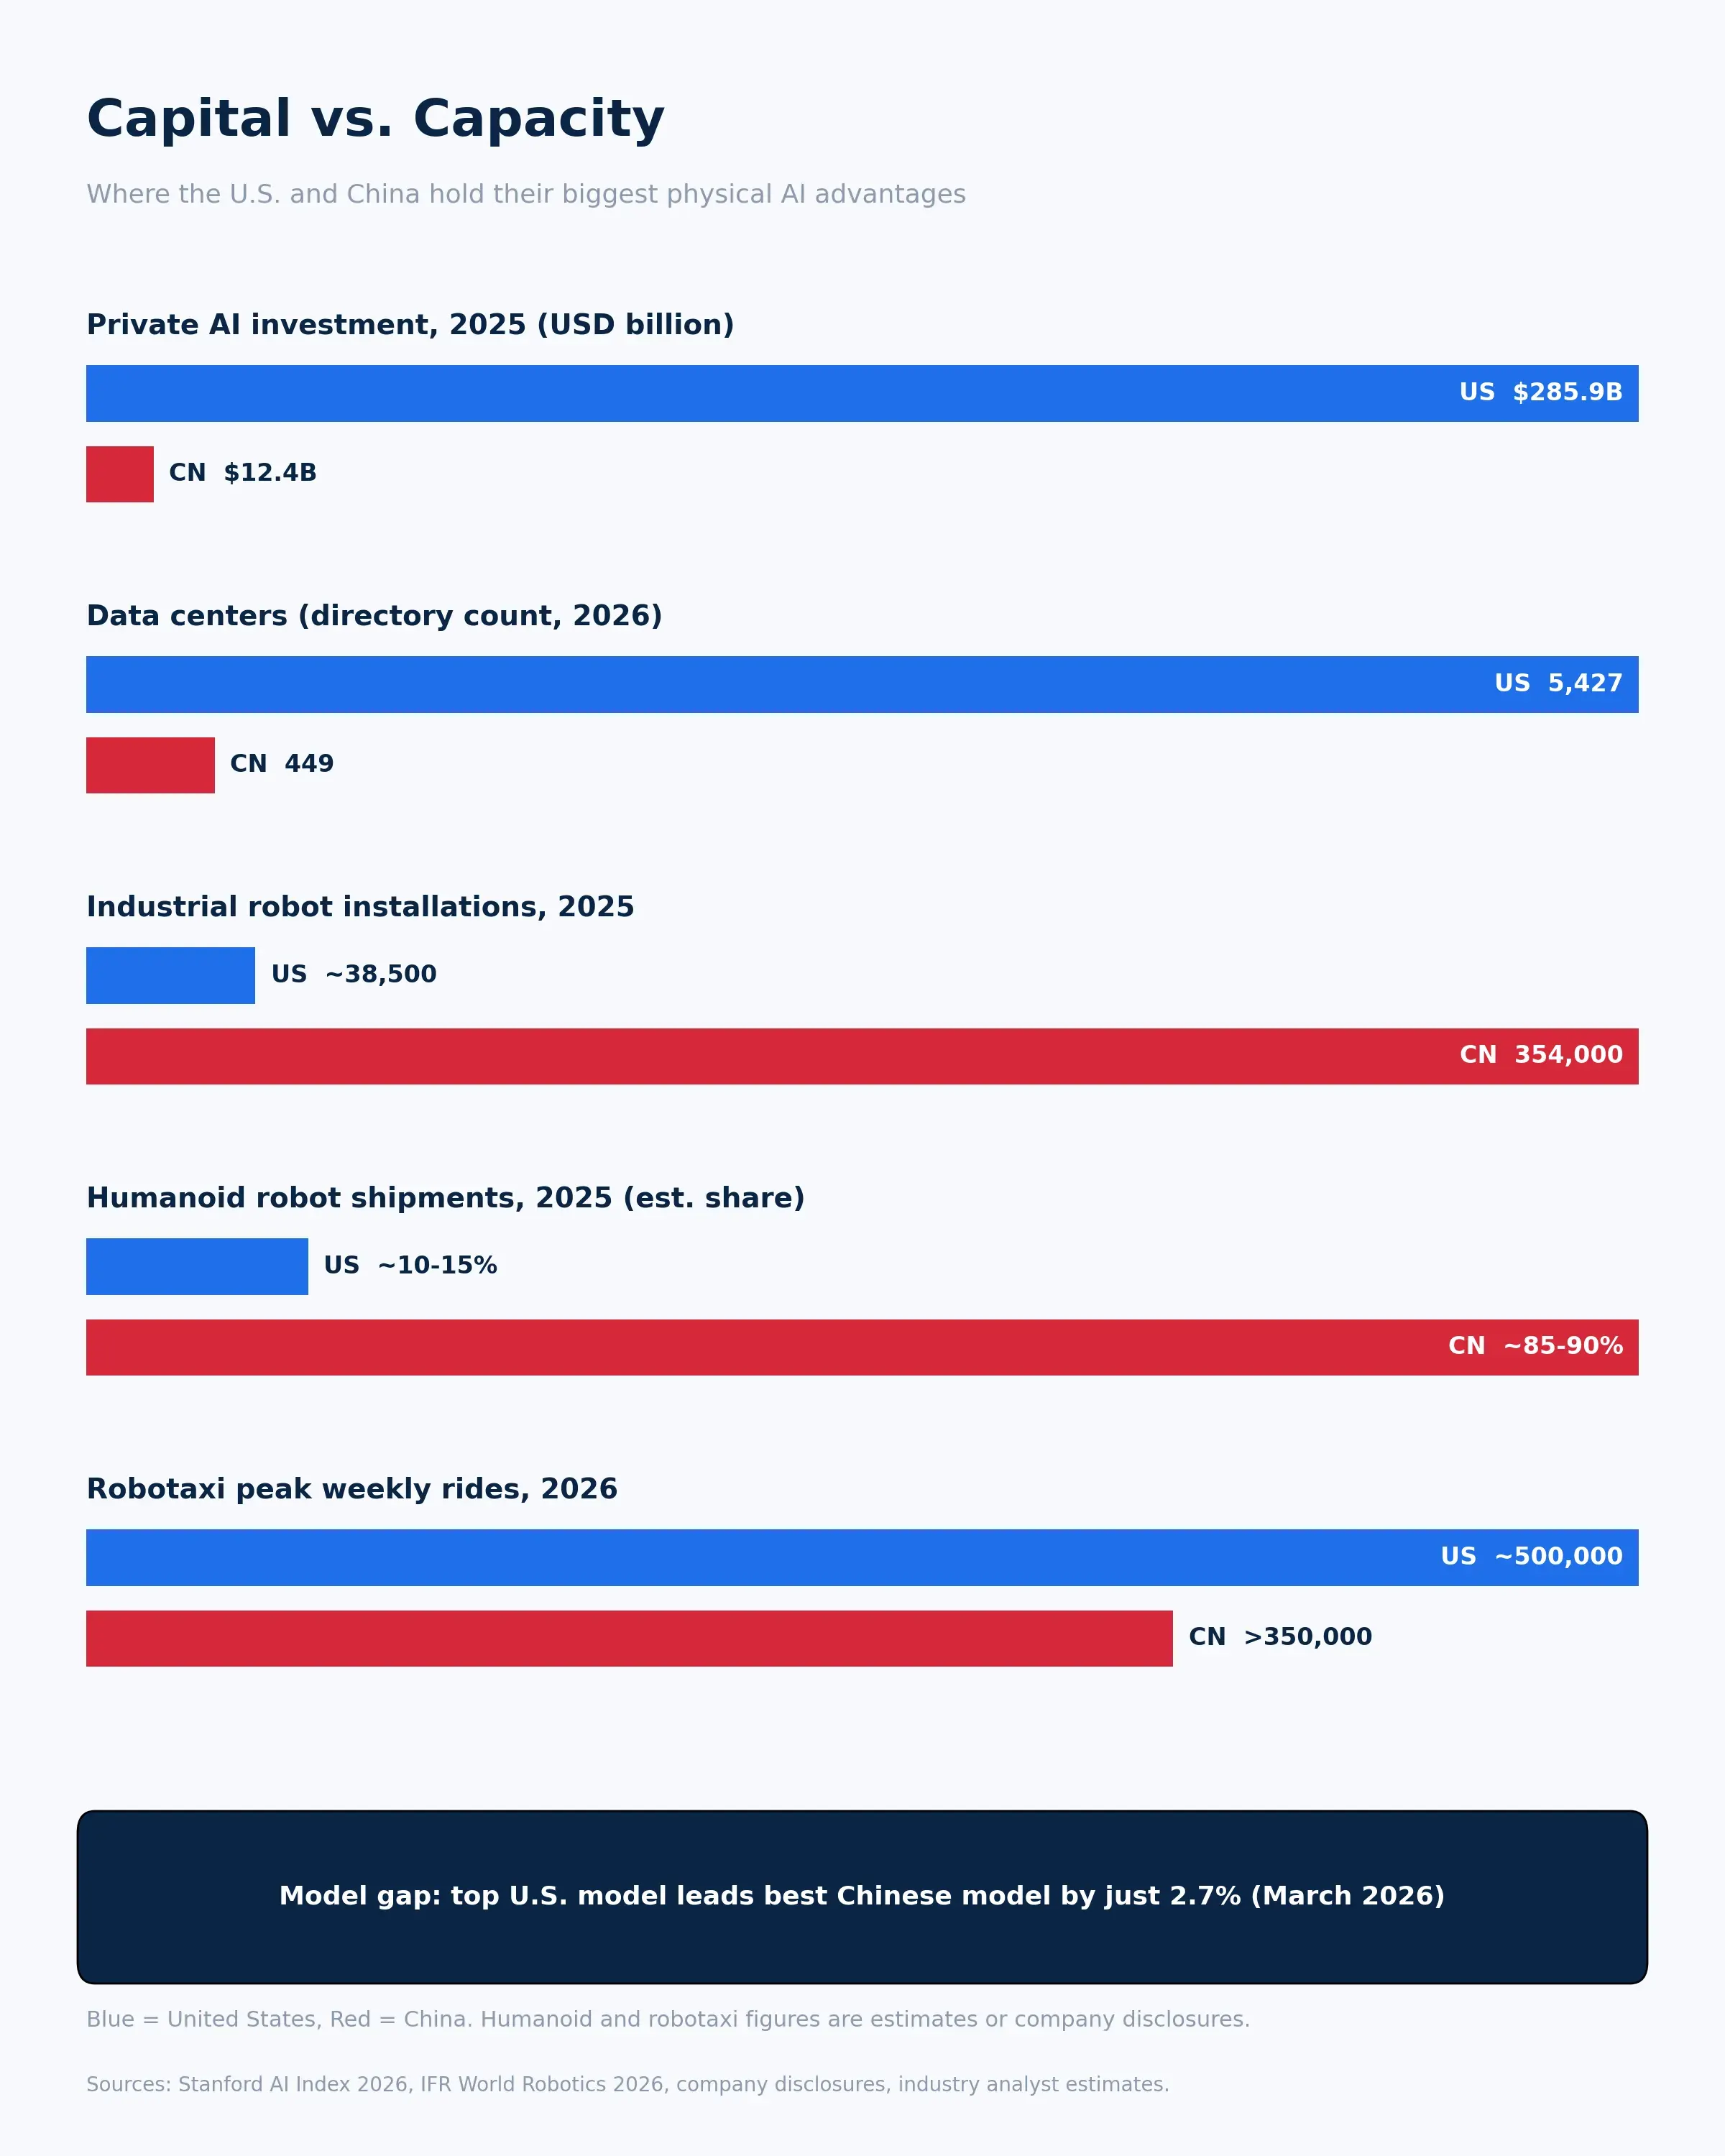
American investors funded AI at a pace no other country matches. U.S. private AI investment reached $285.9 billion in 2025, against $12.4 billion in China. The U.S. also counted 1,953 newly funded AI companies, more than ten times the next closest country.
One caution applies. Stanford's 2026 AI Index notes that private figures likely understate Chinese spending because state guidance funds sit outside the tally.
Robotics startups benefit directly. Figure raised more than $1 billion in September 2025 at a $39 billion valuation. Skild AI followed in January 2026 with about $1.4 billion at a valuation above $14 billion, and Physical Intelligence raised $600 million at $5.6 billion in November 2025.
A market with strong projected momentum
According to experts, the U.S. physical AI market size was valued at USD 1,809 million in 2025, and the market is estimated to reach USD 27,275 million by 2035. The market is seen to grow at a promising CAGR of 31.7% during the forecast period of 2026 to 2035.
That outlook rests on a few structural strengths: leading chip designers, deep cloud capacity, top universities and a venture ecosystem willing to fund long development cycles. Installations are also recovering. U.S. factories added about 38,500 robots in 2025, up 12%, which lifted the country past Japan into second place.
Policy turns protective
The CHIPS and Science Act committed $52.7 billion to semiconductors, which shapes physical AI because every advanced robot depends on high-performance processors. The newer step is more direct. On July 28, 2026, the Federal Communications Commission added foreign-produced humanoid and quadruped robots to its Covered List, blocking new equipment authorizations on national security grounds. Robots already authorized can still be sold, and companies may seek conditional approval. Reporting put China's share of this product category near 85%.
Side by Side: Policy and Capital Compared
| Dimension | China | United States |
| Policy model | Five-year planning with national targets | Market-led, with trade and security rules |
| Flagship fund | 1 trillion yuan ($138 billion) guidance fund | $52.7 billion CHIPS and Science Act |
| Humanoid stance | Subsidies, standards, training centers | FCC restrictions on new foreign models |
| Capital source | State-guided funds plus private capital | Venture capital, corporate cash, public markets |
| Typical strength | Cost, speed, volume | Models, chips, software |
| Typical weakness | Advanced chip access | Component costs, manufacturing capacity |
Autonomous Vehicles: A Close Race on the Road
Self-driving fleets are the most visible form of physical AI, and here the two countries run close.
Waymo reports roughly 500,000 paid rides per week across about 15 U.S. metros with around 4,000 vehicles, and it targets one million weekly rides by the end of 2026. Baidu's Apollo Go delivered 3.2 million fully driverless rides in the first quarter of 2026, with weekly volume peaking above 350,000 in March. Cumulative rides passed 22 million by April across 27 cities. Some reports suggest second-quarter volume fell to about 1 million after regulatory pauses in several Chinese cities, a reminder that growth is not linear.
The difference is footprint. Waymo is concentrated in U.S. cities, while Apollo Go operates in China and Dubai, with testing under way in Hong Kong and London.
Humanoids: Prototypes Meet Production Lines
Humanoid robots attract the headlines, yet 2025 shipments were small. Analyst estimates put the global total between 13,000 and 17,000 units, with Chinese makers holding roughly 85% to 90%.
| Company | Country | Approx. 2025 humanoid units |
| Unitree | China | 5,500+ |
| AgiBot | China | 5,200 |
| UBTech | China | 1,000 |
| Tesla | United States | 150 (est.) |
| Figure AI | United States | 150 (est.) |
| Agility Robotics | United States | 150 (est.) |
Chinese officials have said national output could exceed 100,000 units in 2026, though that target covers many manufacturers and remains unproven. U.S. firms pursue more capable general-purpose designs, but with higher costs and smaller production runs.
Battery life, dexterity and safety certification remain open problems on both sides. The decisive variable is not who builds the most impressive demo. It is who reaches reliable performance at a price below the annual cost of a human worker in the target job.
Compute and Infrastructure: The Hidden Foundation
Every physical AI system relies on data centers for training and edge devices for real-time decisions. The U.S. hosts 5,427 data centers, more than ten times any other country, against 449 listed for China. Counts are a rough proxy, but the capability gap is narrow: Stanford found the top U.S. model leading the best Chinese model by only 2.7% in March 2026.
Export controls on advanced chips constrain China, which is responding with domestic chip programs and efficient model design. The cost of training and serving models will shape which robotic applications become economical. Readers tracking this layer of the stack will find our detailed report on AI infrastructure useful for sizing the compute, networking and power behind these systems.
Where Each Country Holds the Edge?
Leadership across robotics and AI capabilities is increasingly divided between the United States and China rather than concentrated in a single market. China is likely to lead in industrial robot volume, accounting for approximately 59% of global installations in 2025, while also dominating humanoid robot shipments with an estimated 85% to 90% of units.
The United States maintains a stronger position in frontier AI investment, with approximately $285.9 billion invested in 2025, and is likely to retain an advantage in humanoid autonomy software through heavily funded AI model developers. Robotaxi scale represents a more competitive field, with Waymo reaching approximately 500,000 weekly rides while Apollo Go has exceeded 350,000 rides during peak periods.
The United States also leads in automation intensity, with approximately 307 robots per 10,000 workers compared with 166 in China, highlighting a different strength based on automation deployment relative to workforce size.
Go Deeper with Our Research
Decision makers who need segment-level forecasts, regional breakdowns and competitive profiles can access our Physical AI report, one of our best-selling publications. For the compute, networking and energy layer behind these systems, our detailed AI Infrastructure report covers the build-out in full.
What Executives Should Do Now
- Plan for a split supply chain. Component sourcing, software stacks and compliance rules are diverging. The FCC action shows hardware origin can change market access overnight.
- Watch unit economics, not demos. Track cost per robot, uptime and payback period.
- Invest in data. Real-world operating data is the scarcest input, and fleets with scale hold a lasting edge.
- Hedge geopolitical exposure. Tariffs, export controls and subsidies can change the math within a single budget cycle.
- Benchmark against both countries. Looking at only one leaves blind spots.
The contest between China and the United States in physical AI is not a single race, and the numbers above show why a simple verdict is misleading. China is building the machines and the factories to produce them in volume. The U.S. is building the intelligence, the chips and the capital base that make machines useful. The winner in any given application will be the side that closes its weakest gap fastest.
Frequently Asked Questions
Who is ahead in physical AI, China or the U.S.?
- China leads in deployment, with 59% of global industrial robot installations in 2025. The U.S. leads in private investment, data centers and automation density per worker.
How many industrial robots does China install each year?
- Chinese factories installed 354,000 in 2025, compared with about 38,500 in the United States.
Who ships more humanoid robots?
- Chinese manufacturers, with an estimated 85% to 90% of 2025 shipments.
How fast is the U.S. physical AI market expected to grow?
- Cervicorn Consulting projects growth from USD 1,809 million in 2025 to USD 27,275 million by 2035, a CAGR of 31.7%.
Will humanoids replace factory workers soon?
- Not in the near term. Shipments remain in the thousands, and cost and reliability must improve first.
Sources referenced: International Federation of Robotics World Robotics 2025 and 2026 reports and robot density release (April 2026), Stanford AI Index 2026, Federal Communications Commission notice of July 28, 2026, company disclosures and industry analyst estimates.
Our Physical AI Market report is ready for delivery. Message me directly for a preview and a custom quote tailored to your research needs. sales@cervicornconsulting.com | +91 8983225533